What Seattle Home-stay Hosts can learn from Airbnb’s Data
© Sajid Sarker, 2020.
Motivation
Airbnb, Inc.[1] is an online marketplace where hosts and guests can organise bookings of temporary lodgings for home-stays. The company itself does not own real estate or hotel properties, but acts as brokers receiving commissions on bookings for maintaining the platform for hosts and guests.
Having called Seattle (WA) a home for several years now, I was quite excited to be able to sink my teeth into this project. For my project, I utilise data regarding listings of properties by Airbnb hosts in the city of Seattle between 2016-2017 for exploratory data analysis and regression analysis using the CRISP-DM process. I identify several questions of business interest which I attempt to answer through analysis of the available data.
Hopefully, these findings from Airbnb data can provide some illuminating clues for home-stay hosts in Seattle to take advantage of and improve their service and also ameliorate their revenues and ratings. In turn, Airbnb stands to gain a greater platform reputation for the quality of its home-stay experiences.
The Github repository I have created entitled “Seattle Airbnb CRISP-DM Project”[2] contains an HTML knit of the Python Notebook in which I conducted all modelling & analysis.
Additionally, you may find a backup of the dataset from Airbnb along with instructions on how to clone the repository, install relevant Python packages used, and run the notebook in Jupyter Lab.
CRISP-DM
Cross Industry Standard Process for Data Mining is a methodological approach to investigating business questions in a data-driven manner in the field of Data Science. The CRISP-DM Process involves the following steps:
- Business Understanding
- Data Understanding
- Data Preparation
- Modelling
- Evaluation
- Deployment
I apply the relevant steps of this process in my approach for this particular Data Science project. These steps are fully applied and results delineated with code in the Python notebook stored in the aforementioned Github repository.
Business Understanding
On a preliminary review of the data schema, I am interested in finding answers to the following questions:
- What are the highest rated areas to to reserve accommodations in Seattle?
- What are the highest revenue generating neighbourhoods in Seattle?
- Which scores are most important to overall ratings? (Linear Regression)
- Do hosts with higher ratings overall earn higher revenue? (Linear Regression)
- What are the most widely provided amenities listed by hosts in Seattle?
- Which amenities, housing characteristics, and factors contribute positively to revenue? (Linear Regression)
- Which amenities, housing characteristics, and factors contribute positively to ratings? (Linear Regression)
Data Understanding
Data is provided courtesy of Airbnb for the city of Seattle, WA during the period of 2016-2017:
- Listings.csv contains details of properties and pricing
- Reviews.csv contains reviews after home-stays
- Calendar.csv contains pricing for listings on specific days
I only use the datasets titled Listings.csv and Reviews.csv, as Calendar.csv does not contain data pertinent to the context of my questions.
Exploration
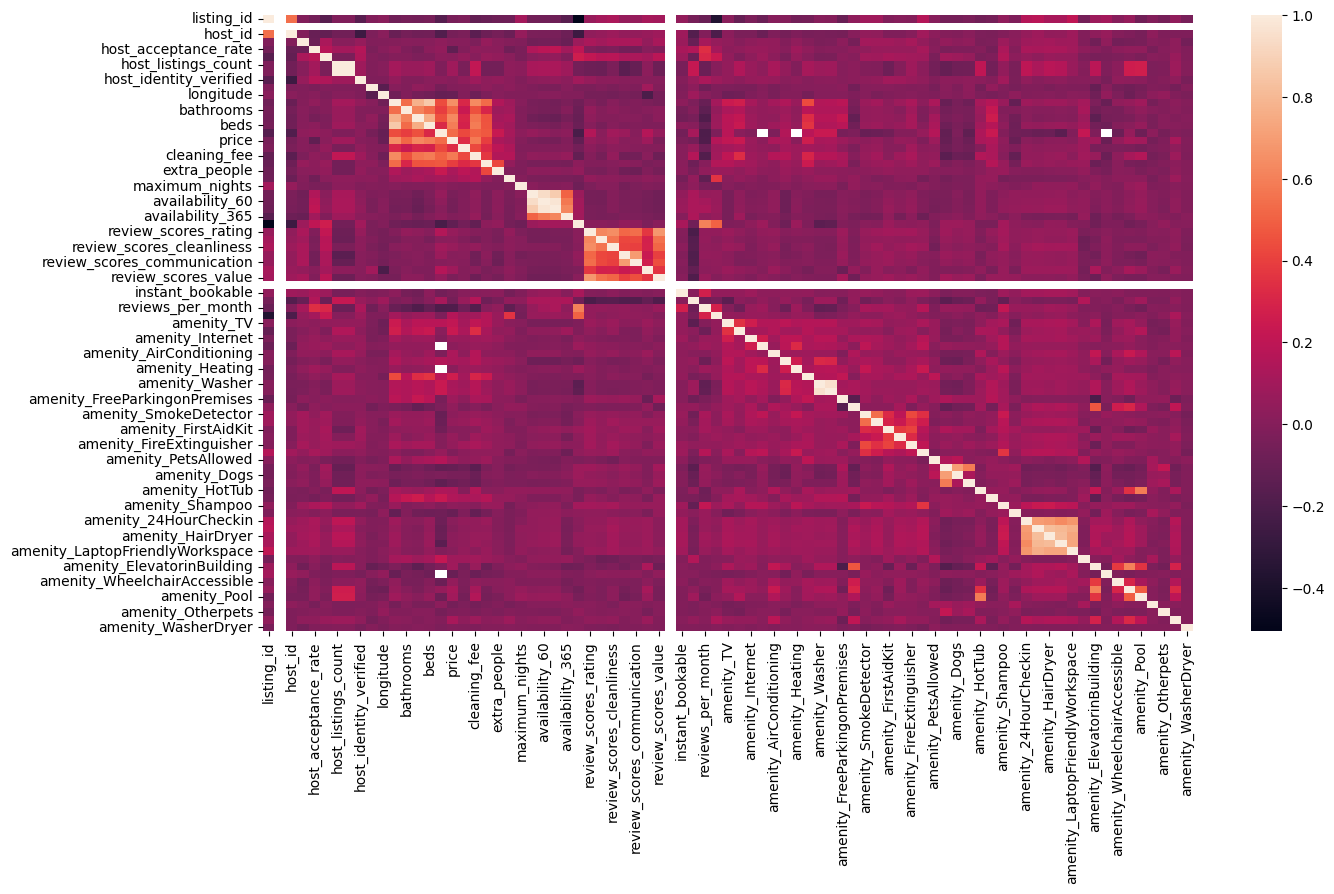
Figure 1. Correlation heatmap of our fully cleaned and prepared dataset.
There appear to be distinct clumps of features exhibiting higher degrees of correlation. Amenities which are common tend to be present due to potential legal requirement or as a standard, therefore exhibiting positive correlation. Additionally, certain luxurious amenities are correlated with higher priced listings.
Property configuration (beds, bathrooms) are nearly perfectly related as they are somewhat dependent on each other or can be imputed due to standard industrial configuration in the housing market (e.g. 2 bed 1 bath). Pricing structures exhibit stronger correlation as high priced listings are correlated with higher maintenance charges.
Analysis
1. What are the highest rated areas to to reserve accommodations in Seattle?
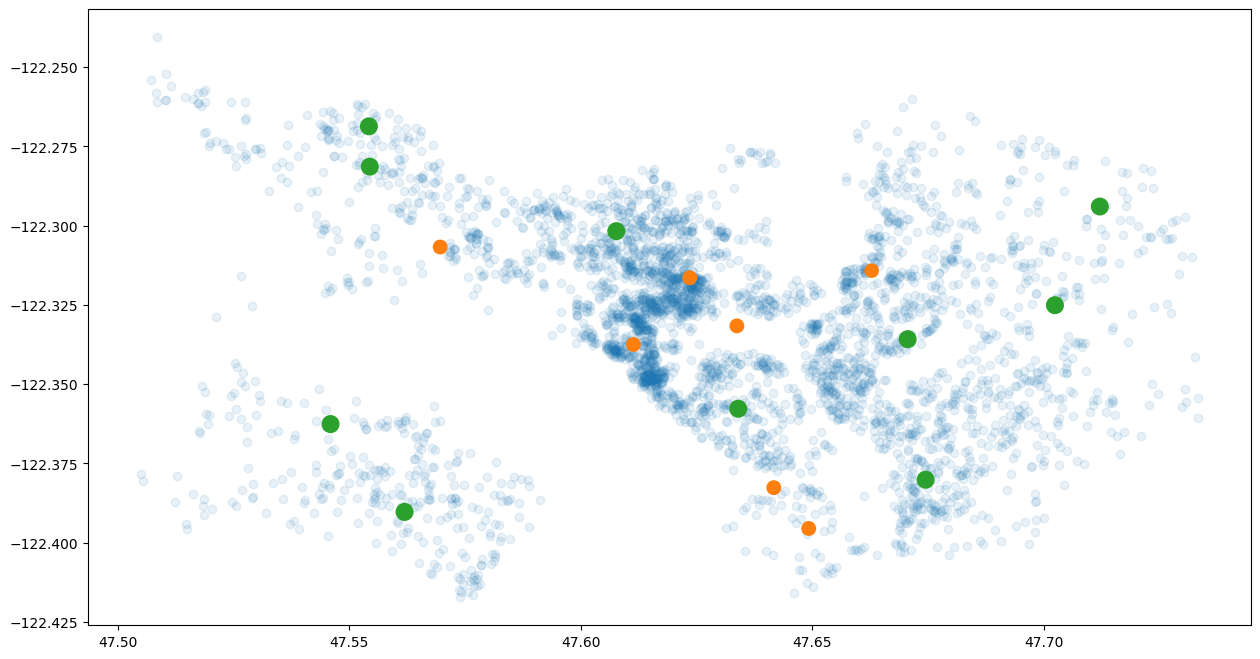
Figure 2. Seattle’s highest rated neighbourhoods.
The highest rated neighbourhoods in Seattle are displayed as green dots on the map above depicting coordinate locations of all listings present in the dataset. Orange dots represent the remainder of neighbourhoods in Seattle whose average ratings do not place it in the Top 10.
| area | mean_rating | |
|---|---|---|
| 4 | Central Area | 96.163957 |
| 8 | West Seattle | 96.061576 |
| 12 | Delridge | 95.987342 |
| 0 | Queen Anne | 95.701695 |
| 1 | Ballard | 95.686957 |
| 13 | Seward Park | 95.022727 |
| 14 | Northgate | 94.912500 |
| 11 | Rainier Valley | 94.911950 |
| 2 | Other neighborhoods | 94.785894 |
| 16 | Lake City | 94.701493 |
Table 1. Seattle’s highest rated neighbourhoods.
The Top 10 highest rated neighbourhoods are listed in the above table in descending order of average rating.
Central Area, West Seattle, and Delridge are the Top 3 highest rated neighbourhoods in Seattle overall. Certain characteristics inherent to the neighbourhood and to the property and amenities in these areas are positively associated with strong ratings.
2. What are the highest revenue generating neighbourhoods in Seattle?
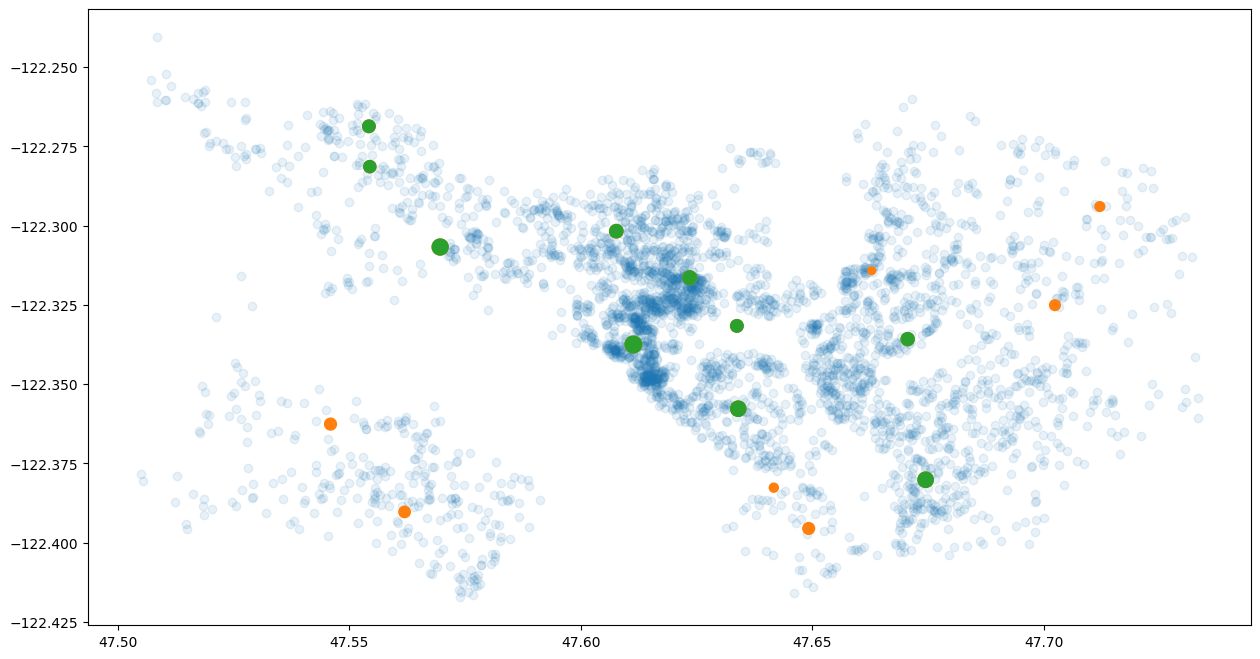
Figure 3. Seattle’s highest revenue generating neighbourhoods.
The highest revenue generating neighbourhoods in Seattle are displayed as green dots on the map above depicting coordinate locations of all listings present in the dataset. Orange dots represent the remainder of neighbourhoods in Seattle whose average revenue does not place it in the Top 10.
| area | mean_revenue | |
|---|---|---|
| 6 | Downtown | 7247.666038 |
| 10 | Beacon Hill | 6606.983051 |
| 1 | Ballard | 6078.726087 |
| 0 | Queen Anne | 6038.752542 |
| 15 | Capitol Hill | 4951.910053 |
| 4 | Central Area | 4636.371274 |
| 2 | Other neighborhoods | 4409.843829 |
| 3 | Cascade | 4075.134831 |
| 13 | Seward Park | 4063.500000 |
| 11 | Rainier Valley | 3827.345912 |
Table 2. Seattle’s highest revenue generating neighbourhoods.
The Top 10 highest revenue generating neighbourhoods are listed in the above table in descending order of average revenue.
Downtown, Beacon Hill, and Ballard are the Top 3 highest revenue generating neighbourhoods in Seattle overall. Certain characteristics inherent to the neighbourhood and to the property in these areas are positively associated with strong revenue generating potential.
3. Which scores are most important to overall ratings? (Linear Regression)
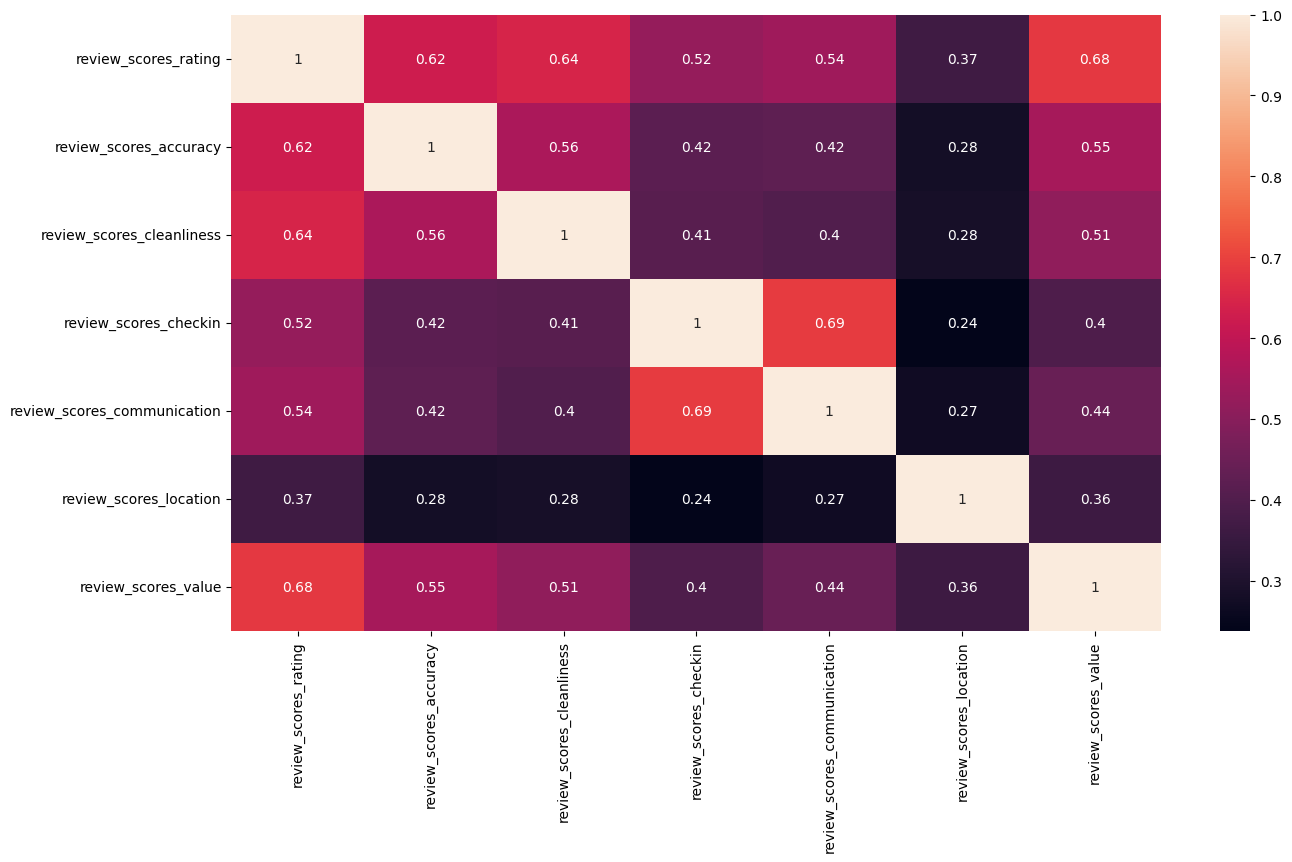
Figure 4. Heatmap of correlation between overall ratings & component ratings.
There appears to be a relatively strong positive correlation between overall ratings and component ratings scored by guests for listings.
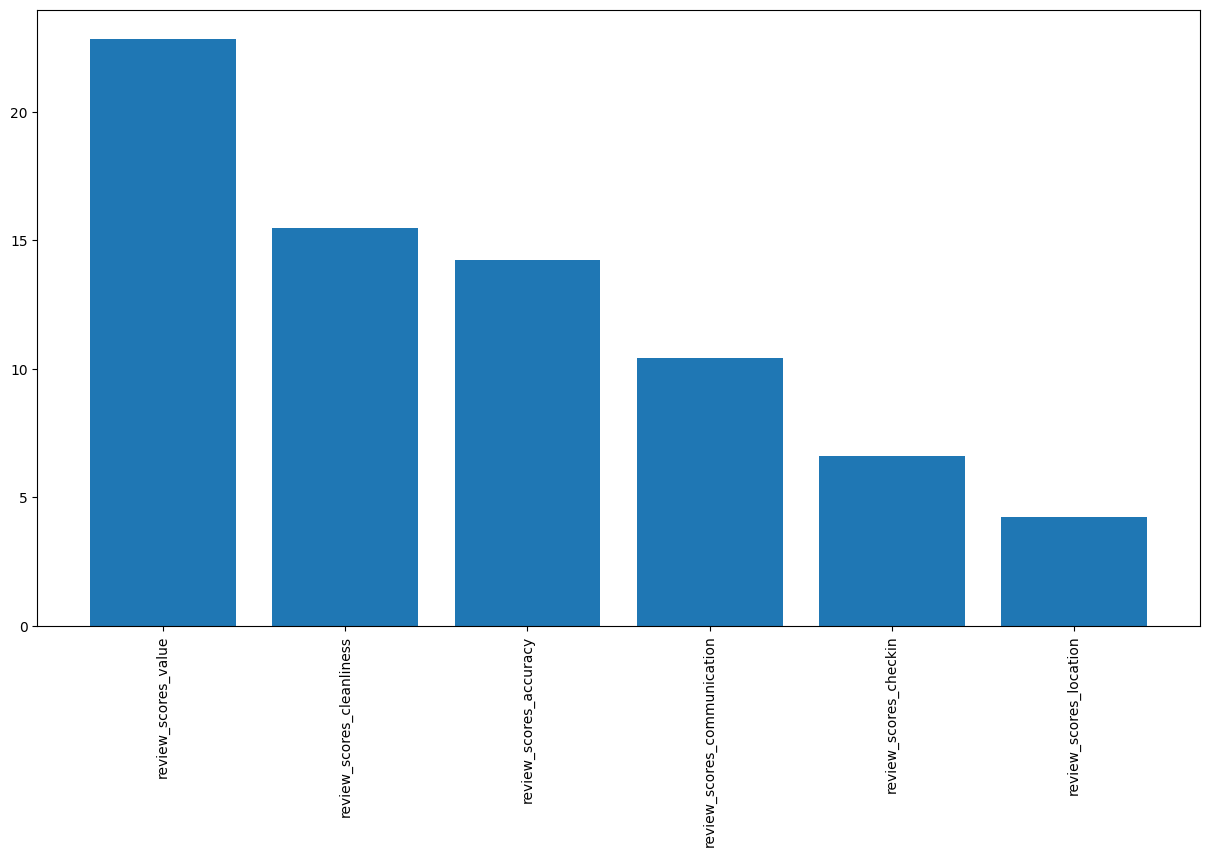
Figure 5. Component rating importance to overall rating.
It appears that conducting a regression on the training dataset indicates that component review scores explain 56.76% of overall review rating for test dataset in this linear regression model.
| review_scores_rating | |
|---|---|
| review_scores_value | 0.682126 |
| review_scores_cleanliness | 0.643828 |
| review_scores_accuracy | 0.622603 |
Table 3. Correlation between component ratings and overall rating.
The Top 3 review factors which impact overall rating for a host are:
- Value
- Cleanliness
- Accuracy
This implies that guests put increased weight on the value for money of their stay, the cleanliness of the accommodations provided by the host, and the degree to which the host’s description of their accommodations accurately match the provided description when determining their overall score for a stay.
This differs from the correlation matrix indicating that check-in experience was the third most correlated contributor to the overall rating, but otherwise relatively matches 2/3 contributors except in order of correlation to coefficient impact.
Hosts wishing to improve their overall ratings can therefore put more effort into maintaining the cleanliness of their premises and providing very descriptive information about their listings on Airbnb. They may also offer competitive rates as is within their means.
4. Do hosts with higher ratings overall earn higher revenue? (Linear Regression)
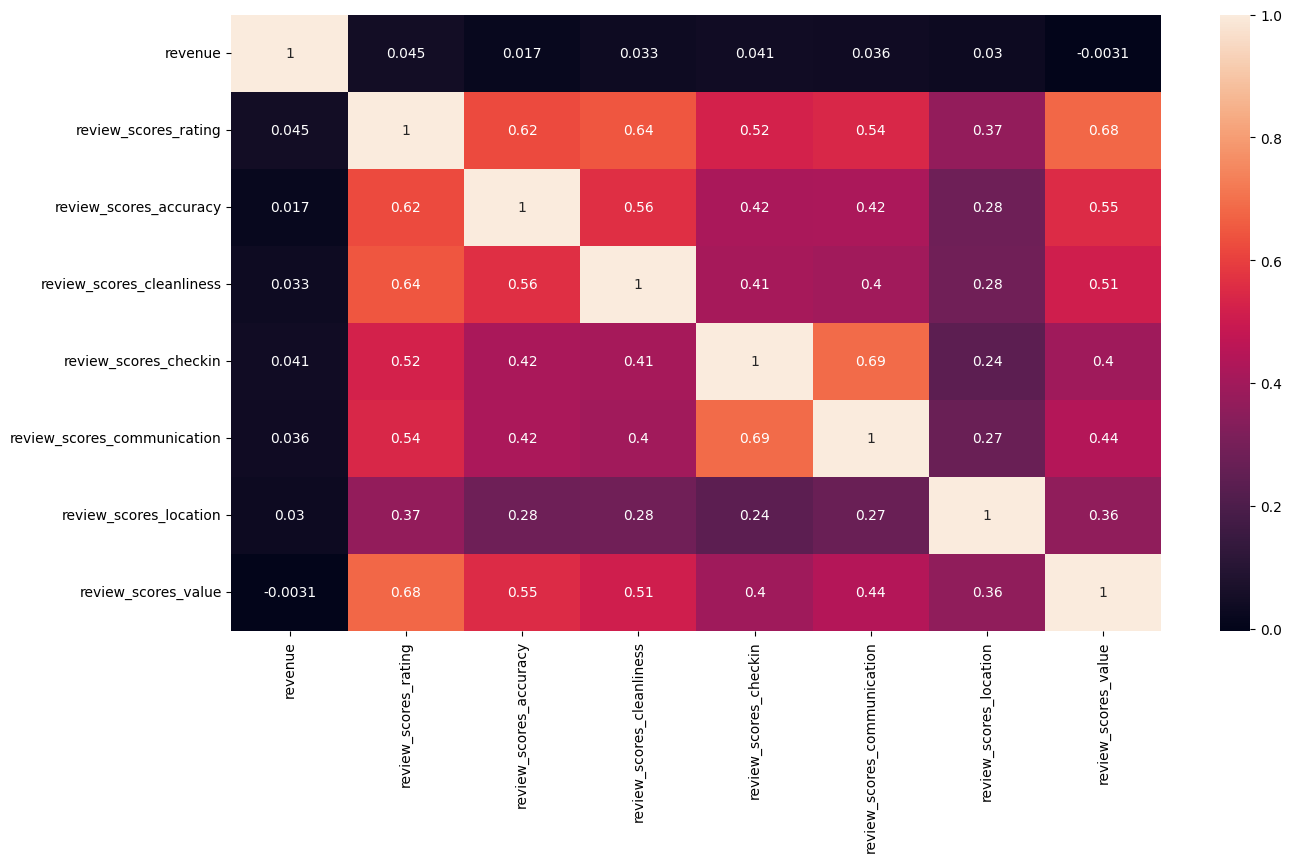
Figure 6. Heatmap of correlation between revenue and overall & component ratings.
At first glance, there is virtually no correlation between revenues generated by a host and the respective overall ratings and component ratings guests score for a stay.
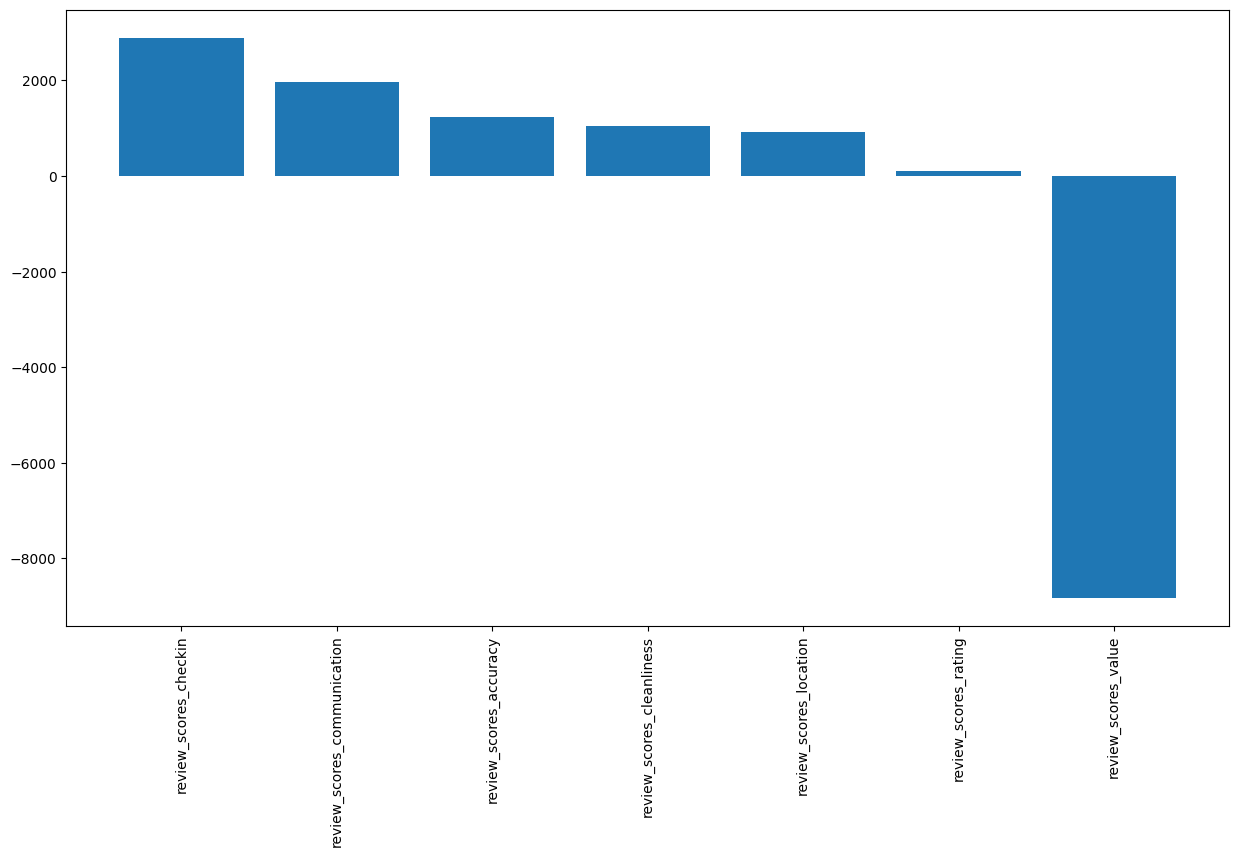
Figure 7. Component and overall rating importance to revenue.
At first, it appears that listings with high value for money ratings are largely associated with the most negative impact on estimated revenues earned. Positive ratings for check-in experience, location, openness in communication of the host, and cleanliness are all positively associated with estimated revenues earned.
Overall ratings are positively associated with the lowest estimated revenues earned. Listings where hosts provided great value and listed accurate descriptions were associated with negative impact to estimated revenues.
However, given virtually no explanatory power (0.11% of target explained by features), virtually no correlation, incredibly high error in our residuals, and statistically insignificant coefficients, it would be inappropriate to interpret any explanatory effect of review ratings on revenue.
We can assume that the revenue generation potential for a listing is interestingly not linked to factors which Airbnb requests its users rate their stays on, and therefore other characteristics and factors are at play from hosts and their property listings.
5. What are the most widely provided amenities listed by hosts in Seattle?
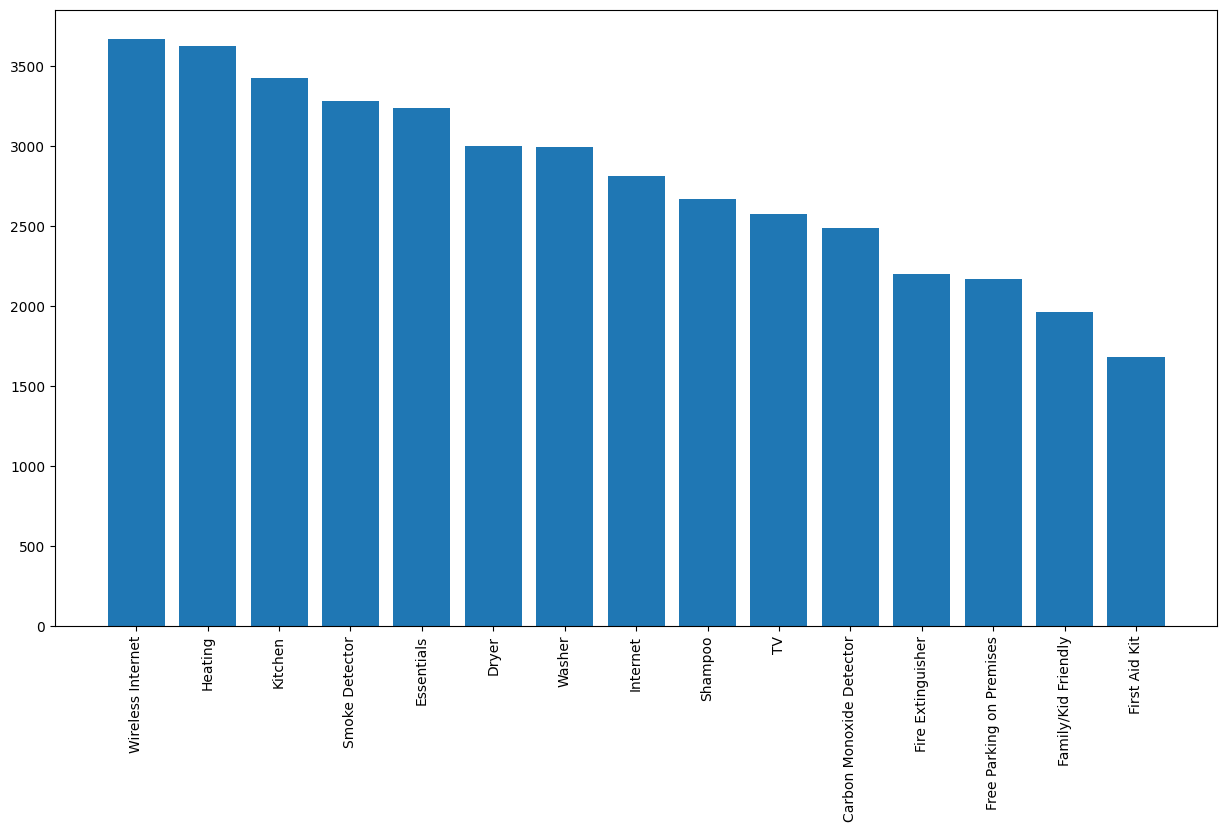
Figure 8. Top amenities provided by hosts in Seattle.
Bar certain amenities which are mandatory perhaps by Washington State laws such as fixtures of smoke detectors, carbon monoxide detectors, and fire extinguishers, the provision of amenities displayed in the bar chart above in descending order of overall availability, indicates some of the most popular conveniences travellers to Seattle would be able to enjoy at an Airbnb.
This can be construed to identify a specific baseline for amenities which a host would need to offer to be fundamentally competitive in the market.
6. Which amenities, housing characteristics, and factors contribute positively to revenue? (Linear Regression)
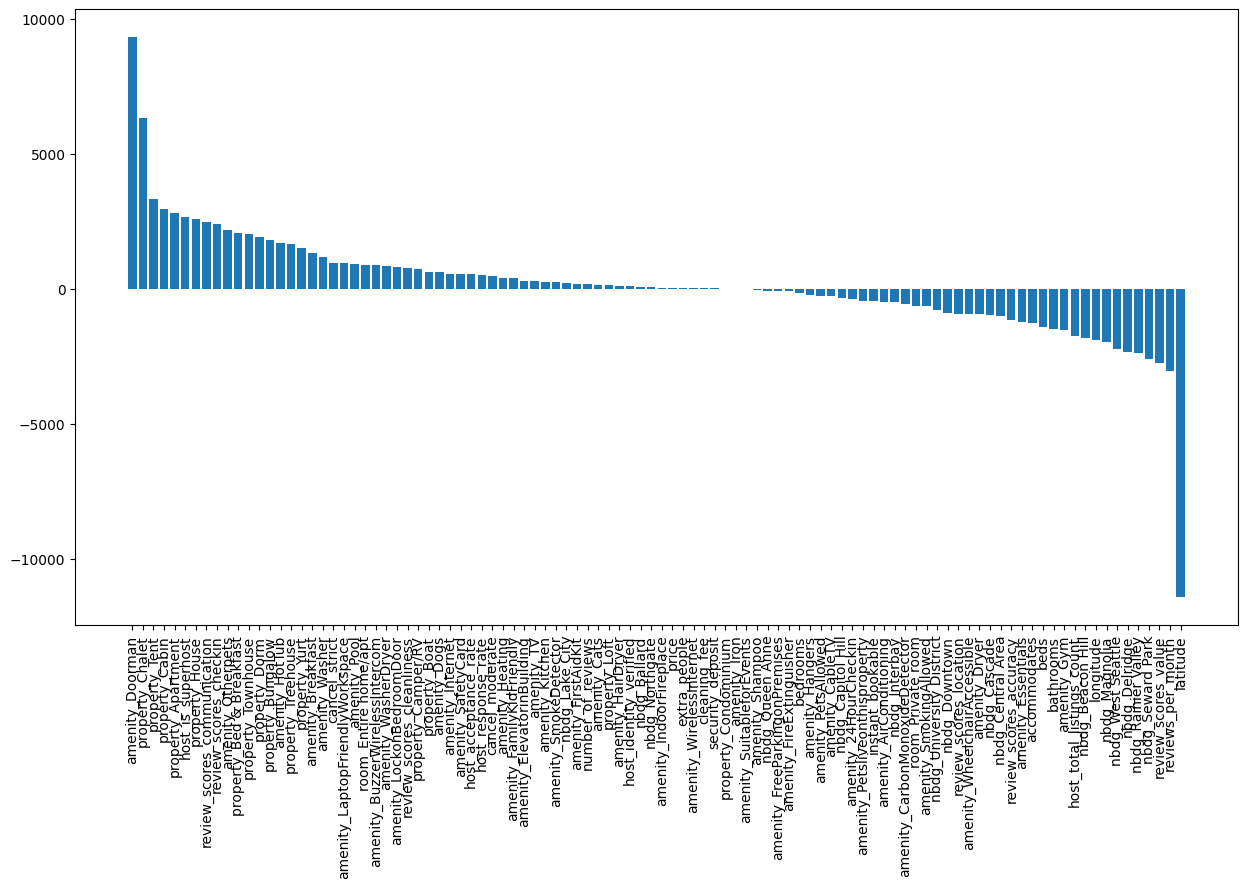
Figure 9. Feature importance for characteristics contributing to host revenue.
The Top 25 amenities, housing characteristics, and similar factors contributing most greatly in positive association to Airbnb host revenues are depicted in the above bar chart.
Revenues are generally positively associated with Airbnb listings with a strict cancellation policy and for hosts with Super Host status. This would imply that verification of hosts in this manner and strong enforcement of scheduling can either ensure higher quality guests, or that well-maintained and valuable properties with experienced hosts tend to attract more guests. It also appears that guest ratings for the check-in experience is also a factor which is positively associated to revenue.
When considering if a particular listing is of room type ‘Entire Home or Apartment’ on Airbnb, it is associated strongly with positive contribution to revenue. Listings that are the entire property tend to be more desirable by guests or garner higher prices due to whole units being limited to individual guest demand.
The nature of the particular housing property listed on Airbnb associated strongly with a positive contribution as a feature that explains revenue includes:
- Chalet
- Tent
- Cabin
- Apartment
- House
- Bed & Breakfast
- Townhouse
- Dormitory
- Bungalow
- Treehouse
- Yurt
Alternative abodes or luxurious accommodations make for exciting or unique homestay experiences, which is not always offered by hotels which may operate to reduce risk for guests and offer the most consistent experience regardless of location in the world. This observation vindicates the unique value proposition Airbnb is able to offer in the industry.
Amenities which are valuable in order of descending value in positive association to revenue include:
- Doorman
- Other Pets
- Hot Tub
- Breakfast
- Washer
- Laptop-friendly Workplace
- Pool
- Buzzer / Wireless Intercom
- Washer & Dryer
Certain amenities may act as proxies to describe other more concrete aspects of a listing which guests value.
For example, the availability of a doorman and intercom may be considered highly popular as it is a proxy for building security which a guest actually values during the course of their stay.
Availability of hot tubs, remote workplaces, pools, and free breakfast are proxies for luxuries or upscale conveniences that constitute a unique experience guests value and seek out on Airbnb.
No particular neighbourhoods stand out as significant features with positive contributor to revenue, except that of properties listed in the neighbourhoods of West Seattle, Magnolia, Delridge, Rainier Valley, and Seward Park will experience lower revenue.
7. Which amenities, housing characteristics, and factors contribute positively to ratings? (Linear Regression)
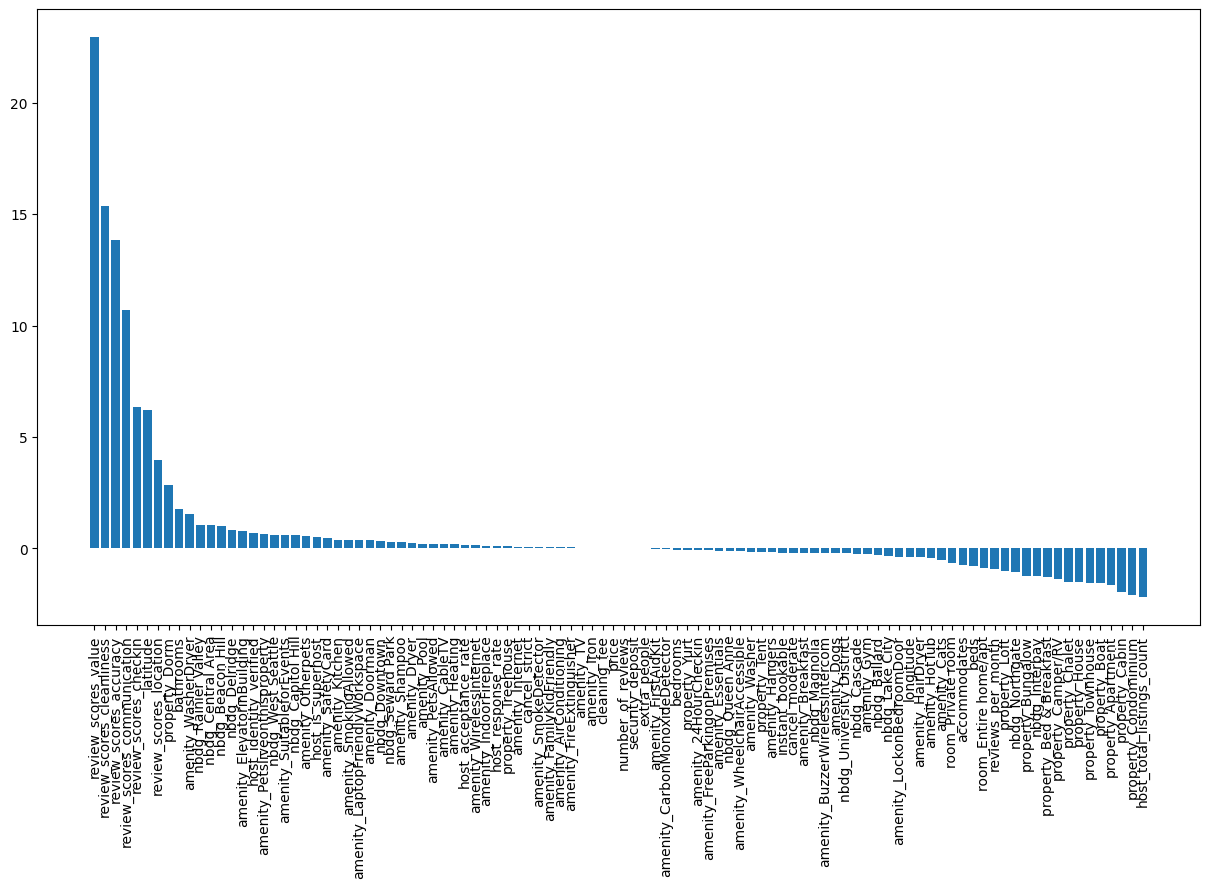
Figure 10. Feature importance for characteristics contributing to host overall rating.
The Top 25 amenities, housing characteristics, and similar factors contributing most greatly in positive association to Airbnb host ratings are depicted in the above bar chart.
Ratings are generally positively associated with Airbnb listings where hosts hold Super Host status and are verified. This would imply that positive recommendation and verification of hosts in this manner attracts and reassures guests that their host can be trusted, is seasoned, and has a reputation for offering a stellar experience.
It also appears that prior investigated ratings of value, cleanliness, listing accuracy, host communication, check-in experience, and location all factor positively and significantly as component measures explaining overall ratings.
Interestingly, dormitory style properties tend to also be well-rated, as do housing with more bathrooms. For the latter characteristic, privacy and accessibility are appreciated by guests, while the former may indicate that guests enjoy shared guest experiences perhaps for socialisation.
Additionally, amenities provided which tend to garner higher ratings are listed as follows:
- Washer & Dryer
- Elevator
- Pets live on property
- Suitable for Events
- Other Pets allowed
- Safety Card
- Kitchen
- Smoker-friendly
Neighbourhoods with positive ratings include Rainier Valley, Central Area, Beacon Hill, Delridge, West Seattle, and Capitol Hill. Interestingly, neighbourhoods previously seen to be associated with lower revenue also tend to be favoured positively in terms of user ratings.
This may indicate that such areas offer high value for guests purely for their location while being low revenue generating perhaps due to earning lower prices with frequent to infrequent overall occupancy.
It may alternatively also be a combination of being located in a highly desirable urban area but costlier for the guest and therefore infrequently occupied garnering overall lower revenues while still commanding high ratings.
The latter alternative would also apply for high revenue generating areas such as Capitol Hill, Central Area, and Rainier Valley which are also highly rated therefore indicating high prices and high occupancy alike.
Evaluation
Given that the scope of this project remained quite small, and the constraints of the CRISP-DM approach with the context of our business questions did not necessitate any predictive analysis or rigorous machine learning models, the regression models produced, while fairly strong in identifying underlying associations, should only be taken as a preliminary investigation into some of the fundamental characteristics for the Airbnb market in Seattle.
In future, were I to extend this project, I would use alternative variations of Generalised Linear Models employed in my analysis here, with better predictive power to gauge feature importance while maintaining similar interpretability.
Additionally, I would use certain techniques in dimensionality reduction such as Principal Component Analysis (PCA) to limit certain groups of features and produce composite features, or exclusion testing to drop features with poor explanatory power for my modelling.
Reference
[2] Github Repository: Seattle Airbnb CRISP-DM
